
Wisen IT Solutions

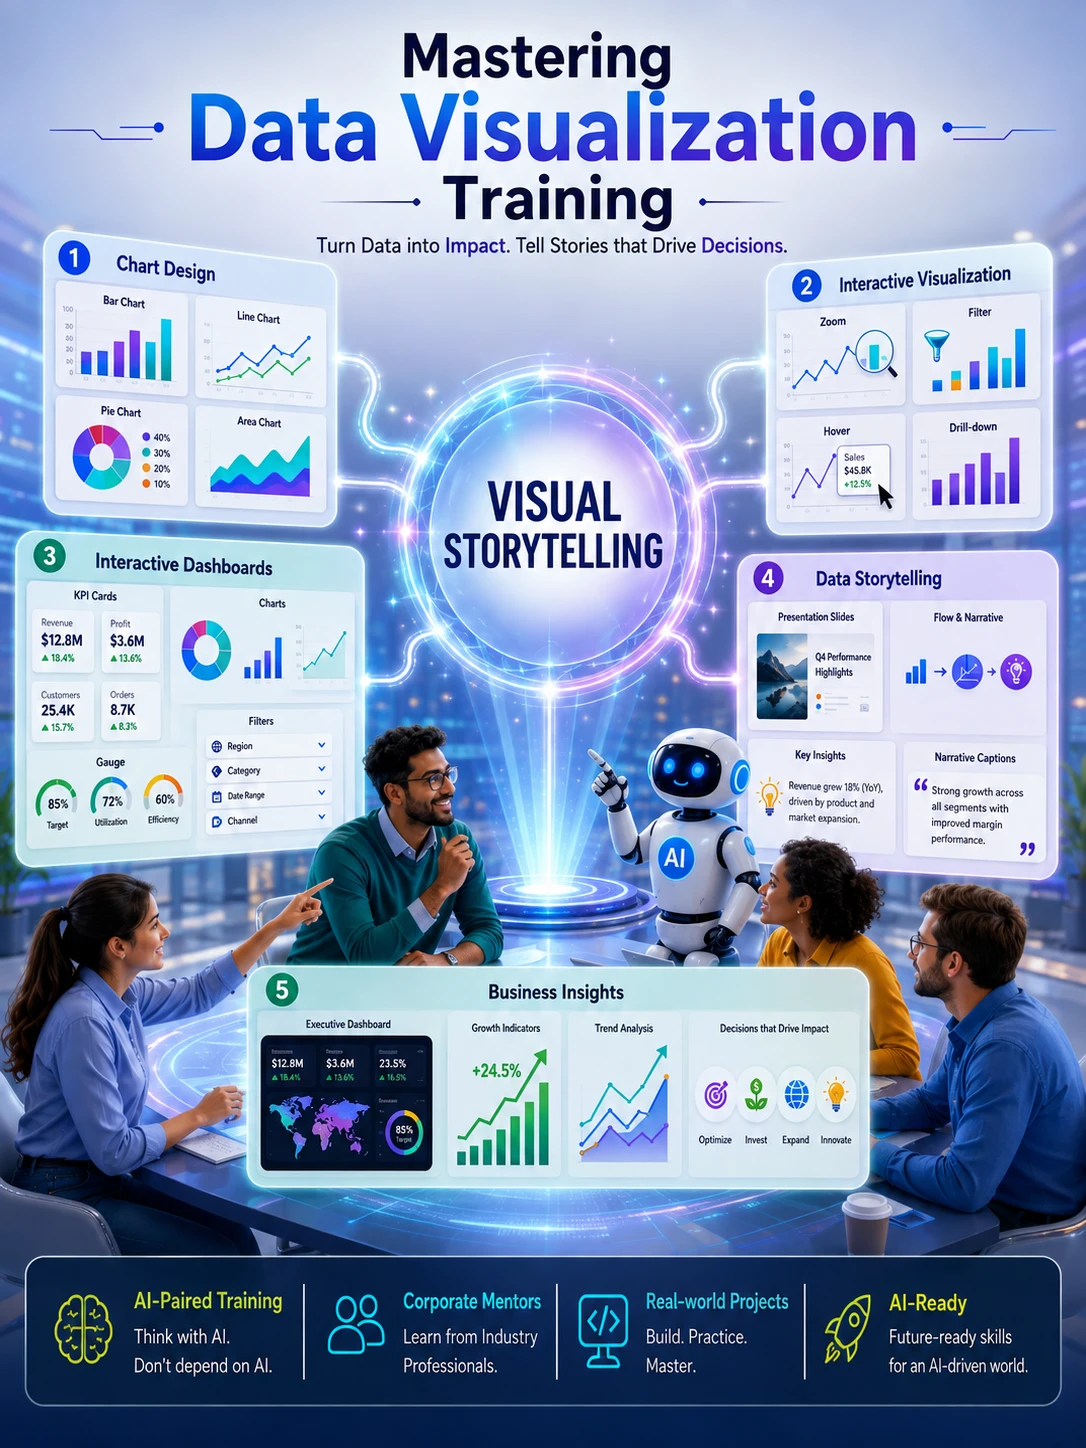
Master Python Data Visualization

Turn Data IntoVisual Stories

Learn to transform data into meaningful visualizations using Python, from trends and comparisons to patterns, relationships, and insights with Matplotlib, Seaborn, and Plotly.

Start Your AI-Assisted Journey
Python data visualization training in Matplotlib, Seaborn and Plotly at Wisen IT Solutions, Chennai, India
The Wisen Difference

Data Visualization Training for AI-Ready Careers

Data Visualization Training at Wisen, Chennai, India, brings together specialized training in Matplotlib, Seaborn, and Plotly to help you turn data into clear visual insights. Explore focused learning paths covering charts, statistical visuals, interactive visualizations, dashboards, and data storytelling for practical projects and AI-ready professional workflows.

Develop Skills That Stay Relevant in the AI Era. Grow from Learner to AI-Enabled Developer

Wisen IT Solutions, Chennai, India
Call +91 900 31 31 555
  • Practical Visualization Skills
  • Modern Python Visualization Tools
  • Interactive Data Storytelling
  • Real-World Visualization Projects
  • AI-Ready Visualization Skills
  • 27+ Years of Training Excellence

Think with AI. Don't Depend on AI.

Wisen IT Solutions, Chennai, India
Data Visualization Courses Catalogue

Data Visualization Training Courses We Offer

Build practical Data Visualization skills with industry-relevant tools such as Matplotlib, Seaborn, and Plotly. Learn to transform complex datasets into clear visual stories through charts, statistical visualizations, dashboards, and interactive graphics. Develop project-ready visualization skills for the AI-Era, communicate insights effectively, and open new career opportunities in today’s data-driven world.

AI-Paired TrainingDeveloper Track

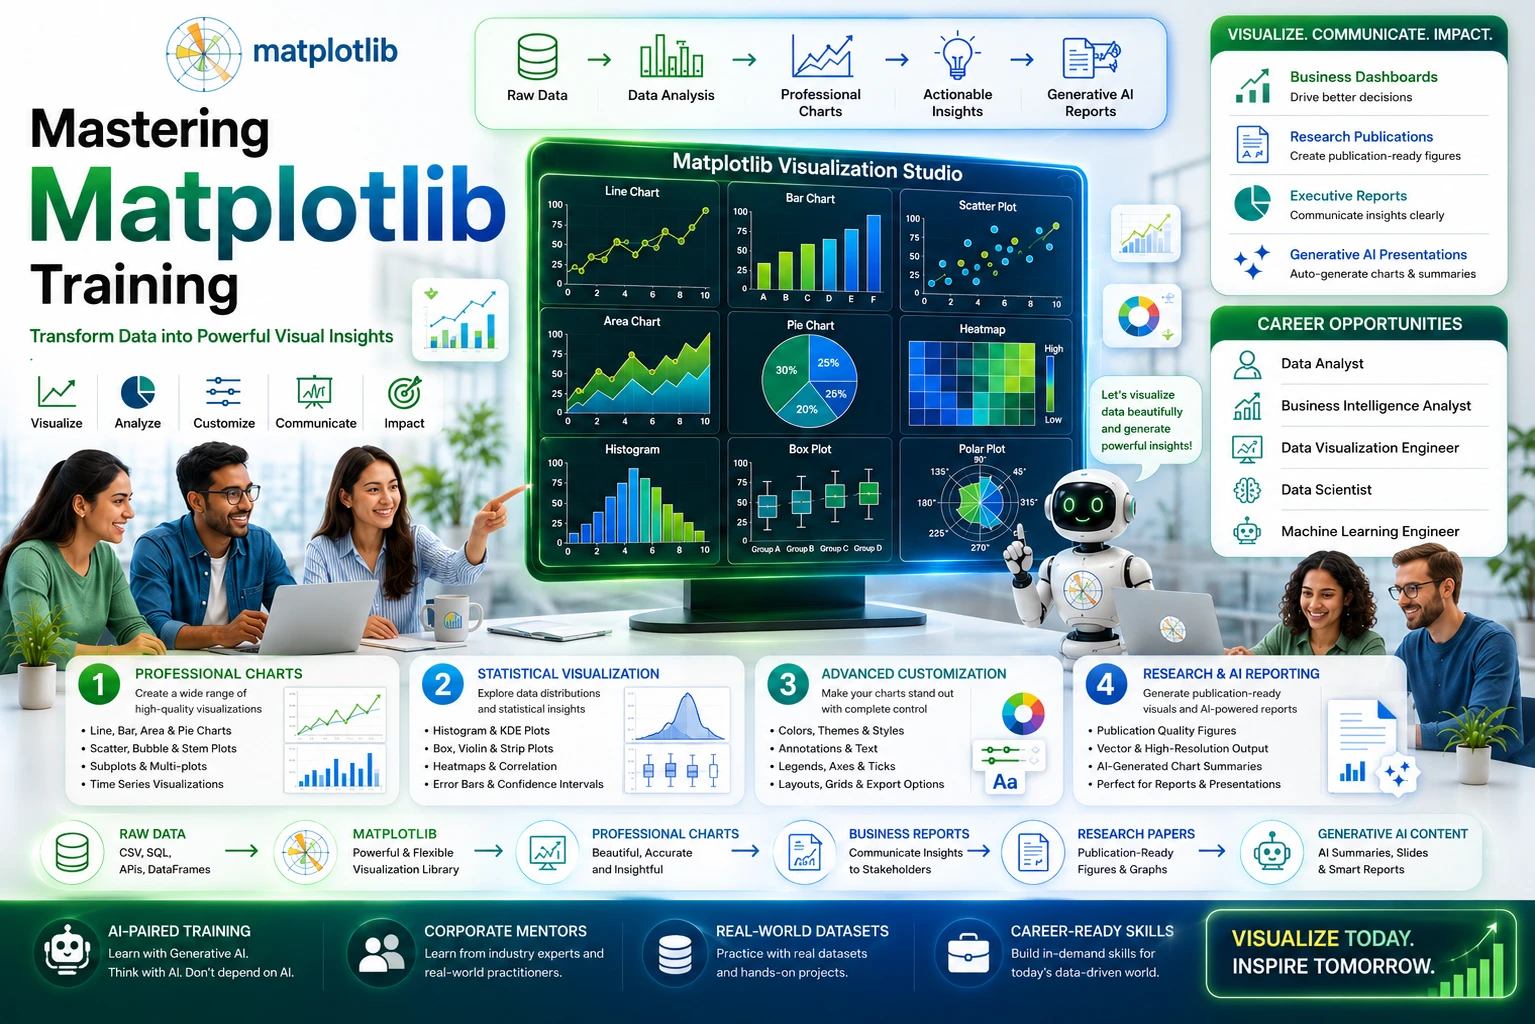
Mastering Matplotlib

Advance your data visualization skills with Matplotlib through publication-quality charts, advanced customization, statistical plots, and compelling visual storytelling for research and AI.

Chapters
10
Framework
Matplotlib 3.x
Learning Ratio
50% Theory • 50% Practical
Duration
60 Theory + 60 Practical
Assessment
Human + Independent AI

Certificate Included

View Training Details
AI-Paired TrainingDeveloper Track

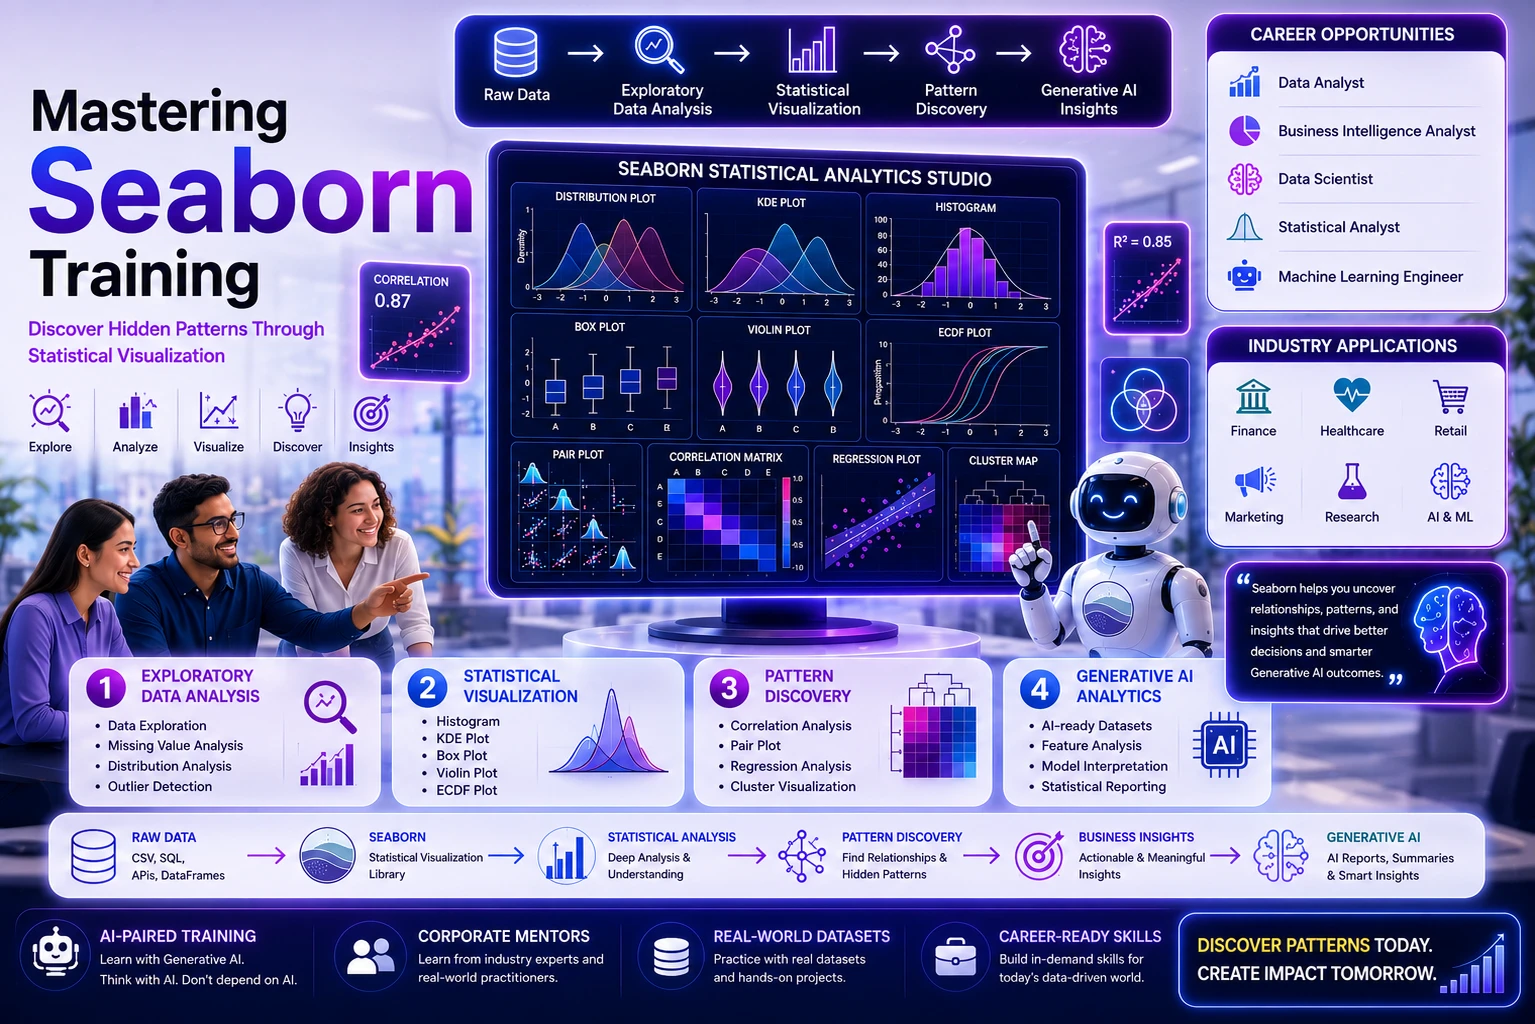
Mastering Seaborn

Advance your statistical visualization skills with Seaborn through distribution plots, correlation analysis, and insightful statistical graphics for analytics, machine learning, and Generative AI.

Chapters
8
Framework
Seaborn 0.13.x
Learning Ratio
50% Theory • 50% Practical
Duration
60 Theory + 60 Practical
Assessment
Human + Independent AI

Certificate Included

View Training Details
AI-Paired TrainingDeveloper Track

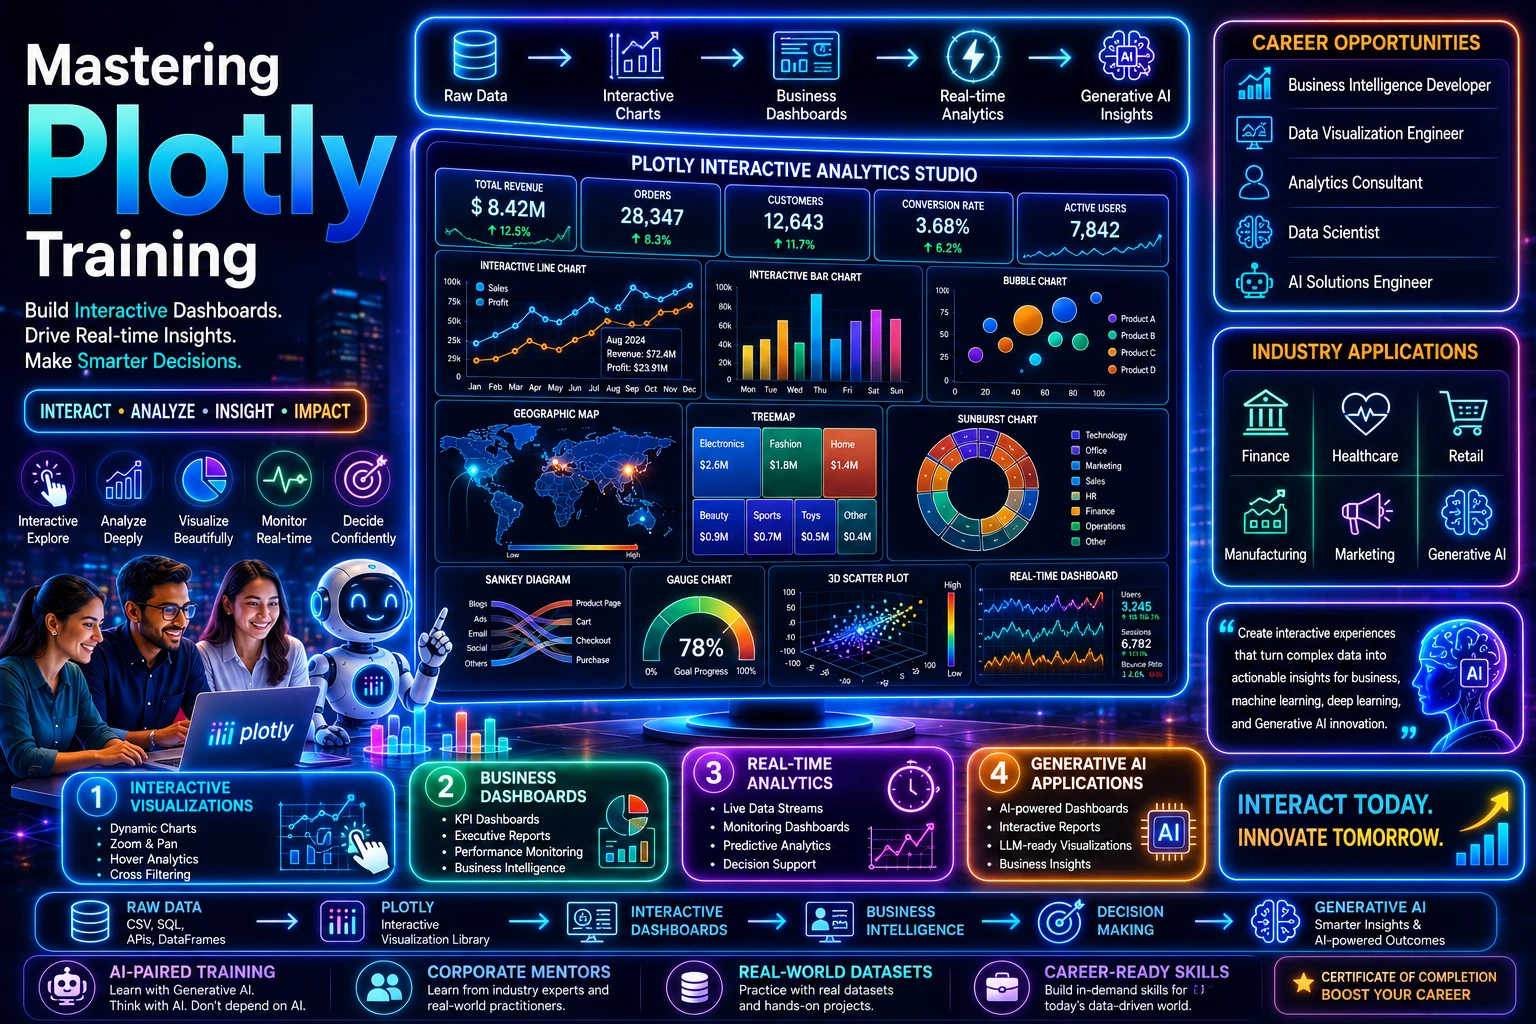
Mastering Plotly

Advance your interactive visualization skills with Plotly through dynamic charts, business dashboards, and real-time analytics for business intelligence, machine learning, and Generative AI.

Chapters
10
Framework
Plotly 6.x
Learning Ratio
50% Theory • 50% Practical
Duration
60 Theory + 60 Practical
Assessment
Human + Independent AI

Certificate Included

View Training Details

Corporate data visualization training for teams at Wisen IT Solutions, Chennai, India

Moving Beyond
Traditional Training
with
AI-Enabled Learning.

AI-Ready Technology
Learning Lab

Moving Beyond
Traditional Training
with AI-Enabled Learning

For Organizations

Corporate Data Visualization Training

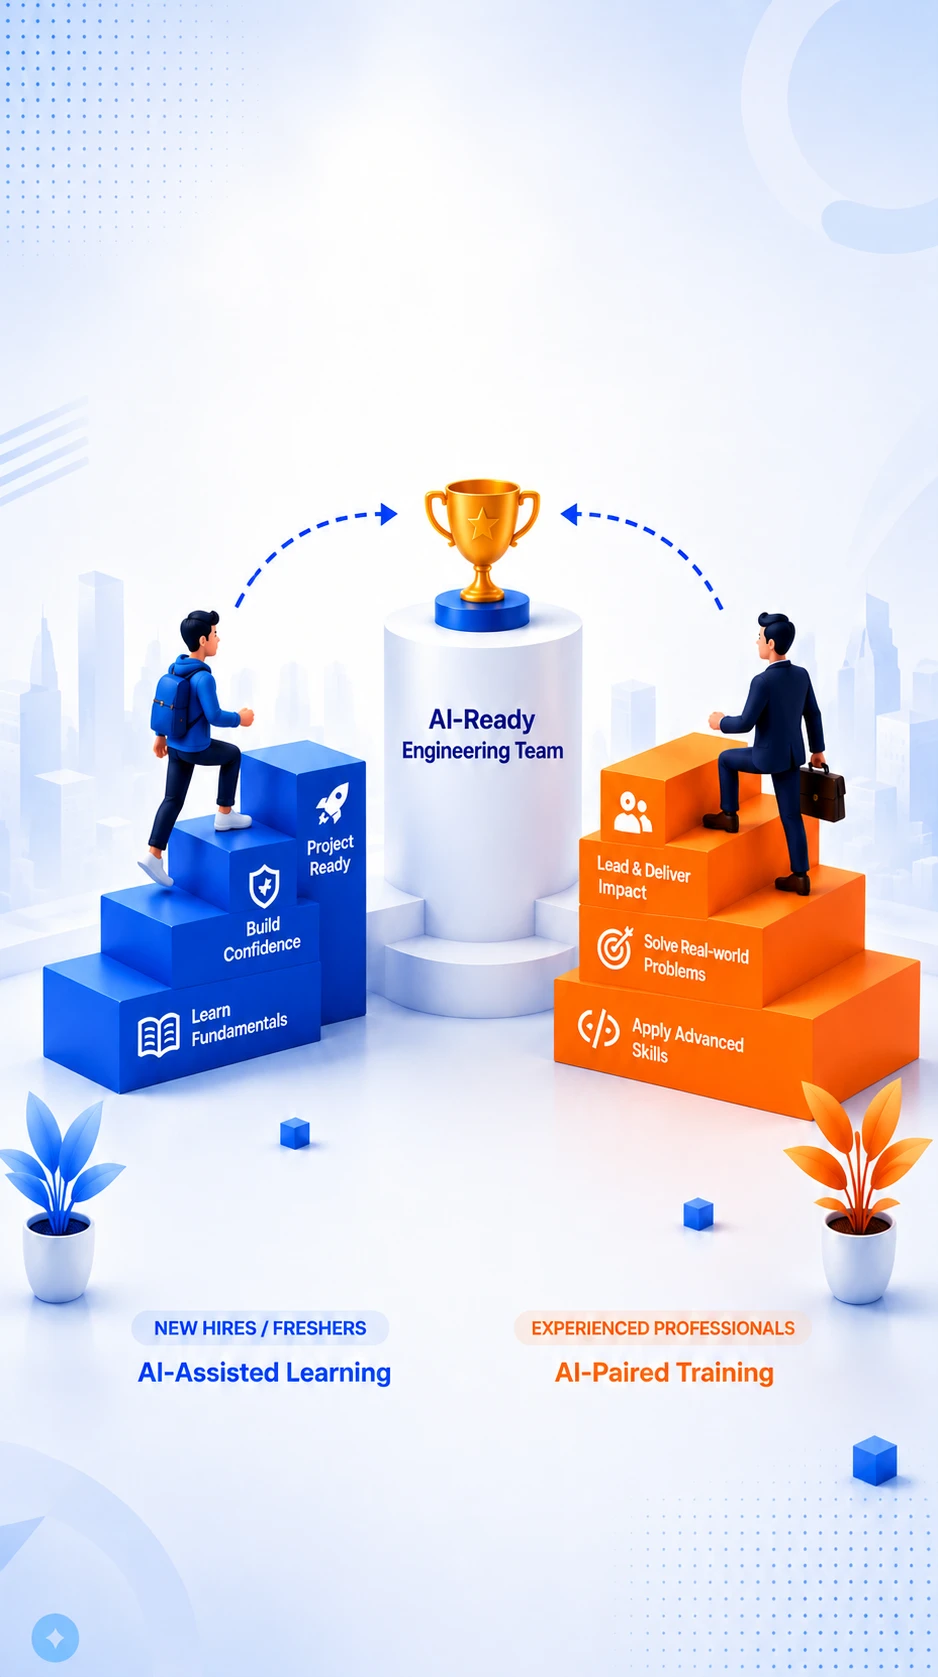
Build practical data visualization capabilities through AI-Enabled Learning across Data Storytelling, Visual Analytics, Exploratory Visualization, Interactive Visualization, and AI-Assisted Visualization Workflows. Wisen’s Data Visualization Training combines AI-Assisted Learning for understanding visualization concepts with AI-Paired Training for practical application, enabling professionals to transform complex data into meaningful visual insights while retaining analytical thinking and creative ownership.

Industry-Relevant Visualization Skills

Develop practical visualization skills aligned with modern analytics, reporting, and data-driven decision-making.

AI-Enabled Learning

Learn to use AI to accelerate visualization exploration, chart selection, analysis, and insight generation without replacing human judgment.

Induction & Upskilling Programs

Build structured learning paths for new hires, freshers, and existing professionals developing or strengthening data visualization skills.

Hands-On Visualization Workflows

Practice data storytelling, chart design, customization, exploratory visualization, and AI-assisted visualization workflows.

Customized Corporate Programs

Align training with your team’s roles, datasets, reporting requirements, technology stack, and business objectives.

AI-Evaluated Skill Development

Evaluate practical progress through AI-assisted assessments that identify strengths, skill gaps, and areas for improvement.

Trusted by

30+ Companies

Trained To Date

17,700+ Professionals

Weekdays & Weekends

Flexible Schedules

Practical Learning

Project-Focused

Looking for a tailored Data Visualization training program for your organization? Let’s build the right learning journey for your team.

Explore Corporate Training Page
Visualize. Explain. Insight.

Skills You Gain from Data Visualization Course

Build the ability to transform data into meaningful visual explanations through a practical Data Visualization Course. Develop visual thinking, chart selection, analytical interpretation, storytelling, and professional communication skills that help you turn complex datasets into clear insights for business, research, analytics, and AI- enabled workflows.

  • Visualization Thinking

    Learn to think about data visually and identify how visual representations can make patterns and findings easier to understand.

  • Chart Selection

    Choose appropriate chart types based on the data, analytical objective, and intended audience.

  • Data-to-Visual Mapping

    Connect variables, measurements, and relationships to meaningful visual structures.

  • Trend Identification

    Use visual representations to recognize changes, movements, and patterns across datasets.

  • Relationship Analysis

    Identify relationships between variables and communicate those relationships through effective visual forms.

  • Distribution Analysis

    Understand how values are distributed and select visual techniques that reveal concentration, variation, and unusual observations.

  • Comparative Visualization

    Compare categories, groups, and measurements clearly without creating misleading visual interpretations.

  • Statistical Visualization

    Apply visualization principles to communicate statistical characteristics and analytical findings effectively.

  • Visual Storytelling

    Organize charts and supporting explanations into a coherent visual narrative that communicates the key message.

  • Chart Customization

    Refine titles, labels, axes, legends, annotations, layouts, and other visual elements for clarity.

  • Interactive Visualization

    Understand how interactive visual experiences can help users explore data and discover additional insights.

  • Visualization Quality

    Evaluate visual clarity, accuracy, consistency, accessibility, and relevance before presenting analytical results.

  • Insight Communication

    Convert analytical findings into understandable visual explanations for technical and non-technical audiences.

  • AI-Assisted Visualization

    Use AI to explore visualization ideas, improve chart implementations, and troubleshoot visual workflows while retaining independent analytical judgment.

  • Professional Data Communication

    Develop presentation-ready visualization skills for reports, dashboards, research, business analysis, and modern AI-enabled data workflows.

Career Transformation Starts Here!

These skills help you move from simply creating charts to communicating data with purpose and clarity. Apply your learning through Data Visualization Course in Chennai and Data Visualization Training in Chennai opportunities while developing practical visualization thinking that supports real-world analytical and professional communication.

91-900 31 31 555
How the verification works

How you verify your Data Visualization skills independently

Most training providers set their own test and mark their own paper. We do not. At the end of each stage of the Data Visualization Training you check your own readiness using your own ChatGPT, Claude, Gemini or other AI account. Wisen does not write the questions, does not see your answers, and does not record your score.

The reasoning is straightforward. A score we control proves very little — to an employer, or to you. A score produced by a tool we have no influence over is worth something. You ask the AI to test you on Data Visualization, it decides what to ask, and the result belongs to you alone.

Seventy per cent is the mark we treat as ready. Score seventy or above and you move on to the next stage. Score below it and we work through the gap with you: identify what was missed, teach it again, practise it, then go back to the AI and check. You repeat that loop as many times as it takes.

In short

  • You use your own AI account, not one of ours.
  • We do not write the questions and cannot influence them.
  • Your score stays private — we never see it.
  • Below seventy per cent, we work through the gap with you and you verify again.
Placement Assistance

Career Support You Can Count On

Data visualization training that ends with a portfolio of charts you can defend. Placement is not something we promise; readiness is what we build.

  1. 01

    Gain 2+ Years of Professional Knowledge

    Choosing the right chart, encoding a variable honestly and knowing when a chart is the wrong answer are editorial judgements. Having them is what two years of the work teaches.

  2. 02

    Resume / Biodata Support

    Get expert guidance to build a strong, professional resume that highlights your skills, projects and achievements.

  3. 03

    Portfolio Development

    Build real-world projects and a strong portfolio that demonstrates your practical skills to potential employers.

  4. 04

    Interview Preparation

    You will be handed a dataset and asked what you would show and why. We rehearse that under observation and review where the reasoning went thin.

  5. 05

    Job Search Guidance

    Visualization skills are screened inside analyst, data science and reporting roles rather than advertised alone. We show you where to place them on the profile.

  6. 06

    Placement Assistance

    We assist you in identifying relevant opportunities and connecting with potential employers.

  7. 07

    Independent AI Verification Checkpoint

    Your learning, projects and skills are verified by our Independent AI Verification System to ensure objective and unbiased evaluation.

  8. 08

    Future-Ready Knowledge

    The grammar of graphics outlives any one library. Learn it here and Matplotlib, Seaborn, Plotly or whatever follows are all the same idea with different syntax.

Our Commitment

We do not guarantee employment. Your outcome depends on your practice, your assessments, your interviews and the employer’s need. We support you at every step regardless.

Live online, worldwide

Join Data Visualization Training from anywhere in the world

Every session is taught live by a practising engineer — never a pre-recorded video. Batches run to Indian Standard Time, and the timing is adjusted to suit your time zone wherever you are.

  • Live, not recorded

    You write code during the session, ask questions as they come up, and have that code reviewed.

  • Your time zone, any country

    Weekday and weekend slots in IST. If none of them suit where you live, we schedule a batch that does.

  • Pay from outside India

    International debit and credit cards, PayPal and direct bank transfer are all accepted.

Ask for a batch timing on your own clock
Three Libraries. One Chart Grammar.

Data Visualization Course Tools & Technologies

This Data Visualization Course teaches Matplotlib, Seaborn and Plotly side by side, so you learn one grammar of figures, axes and encodings and then choose the library that suits the audience.

The live Data Visualization Training also covers the parts most courses skip — colour that survives greyscale printing, accessible contrast, and export settings. The Data Visualization Course in Chennai batch works through the identical figure set.

Plotting Libraries

Matplotlib

Seaborn

Plotly

Style Sheets

Chart Types

Line & Area

Bar & Column

Scatter & Bubble

Distribution Plots

Heatmaps

Small Multiples

Design & Accessibility

Colour Scales

Contrast & Colour Blindness

Labels & Annotation

Axis & Scale Choices

Avoiding Chart Junk

Delivery & Export

PNG & SVG Export

Print-Ready PDF

Interactive HTML

Dashboard Layouts

Notebook Embedding

Learning Outcome

You finish able to pick the right library for the job and produce a figure that reads correctly in a report, a slide or a browser — which is the whole point of the Data Visualization Training in Chennai batch and every live batch we run.

Pick the Right Library

Match Chart to Data

Design Accessibly

Export Anywhere

Official references

Check what we teach against the official library documentation

The three plotting libraries taught in this category each publish a complete reference. Those are the sources the syllabus follows.

Got Questions - Quick Answers

Data Visualization Course Frequently Asked Questions

27+
Years of Experience
17,700+
Professionals Empowered
2,700+
Happy Learners Every Year
30+
Corporate Clients

Corporate Training Clients

A Trusted Training Institute Upskilling Teams at Leading Companies Worldwide

A Wisen IT Solutions Python training advisor pointing towards the enquiry number

Build Future-Ready Skills. Gain Project-Ready Experience.
Succeed in AI-Transformed Careers.

The software industry is evolving with AI—not disappearing. Wisen's AI-Enabled Learning helps you master modern technologies, build strong engineering fundamentals, and collaborate effectively with AI tools like ChatGPT and Claude. Develop the practical skills, critical thinking, and real-world experience needed to build software with confidence and remain valuable throughout your career.

Talk to our AI Learning Advisor

+91 900 31 31 555